- Published on
Beyond Standard APIs: Designing Comprehensive Energy Measurement with eBPF
- Authors

- Name
- Leonard Vincent Simon Pahlke
- @leonardpahlke
This is the third and last blog in the series "Unlock Energy Consumption in the Cloud with eBPF". The first blog can be found here and the second one here.
This is the third and last article of the blogpost series. The first article “The Imperative of Measuring Energy Consumption in the Cloud: When and Why to Begin” and the second article “Navigating the Landscape of APIs for Energy Measurement in the Cloud”. Previously we explored the layers in cloud computing and how they complement each other to get a holistic overview of resource consumption. In this article we will explore how metrics collected at each level need to be complemented with cloud native metrics to extend its usefulness to push energy in the cloud space forward.
What is the responsibility of an orchestrator in the cloud / the OS of the Cloud
Let’s reiterate over the responsibilities of an orchestrator such as Kubernetes in the cloud. This will help us understand which metrics we should collect at this abstraction level. We don't need to deep dive into Kubernetes' functionalities too much; a high level overview of its capabilities should be enough. Kubernetes facilitates the interaction between infrastructure capabilities and platform requirements.
If there is a change in demand of services, it scales the service up or down (scalability), if a new version of an application get’s release it manages updating the pods on nodes (roll out) and reverts the change if an problem occurs (rollback), it detects if a pod crashed and restarts the pod (self healing), if a new deployment is configured it starts pods in its nodes (scheduling), it manages communication of it’s services (egress, ingress over services & network policies), it ensures that deployments are in the specified desired state (declarative configuration), it allocates virtual storage to pods (persistent volumes), it routes traffic between available pods (load balancing), etc.
There are a lot of more capabilities - everything security related was not even mentioned. But this should suffice for now to continue. In the next step we will take a look at which metrics we currently collect. This will highlight limitations of current practices.
Current State of the Art: Cloud Native Energy Measurement
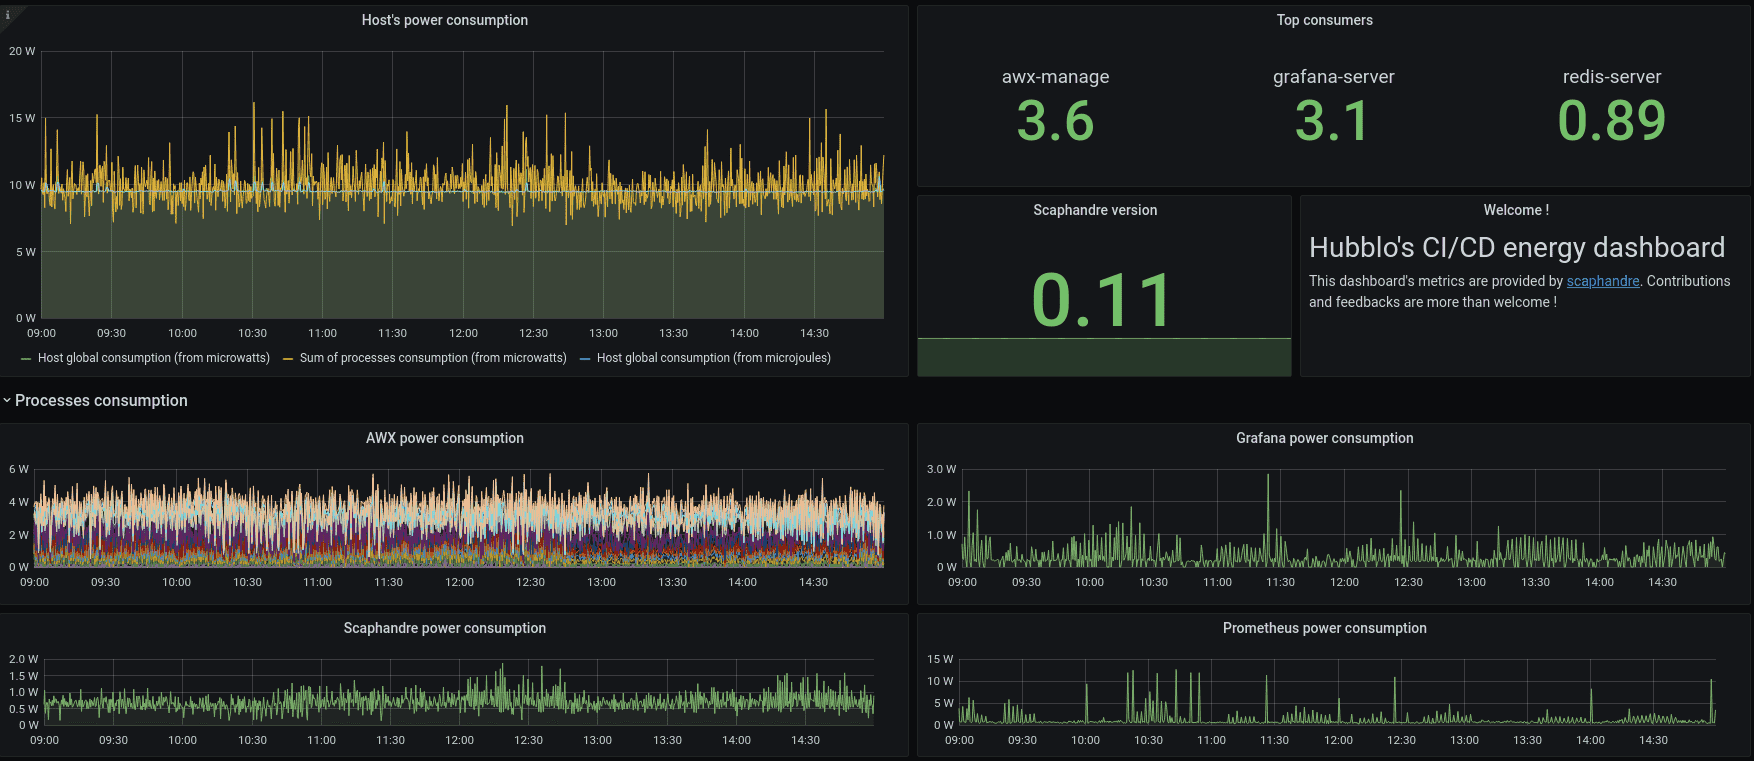
Energy measurement in cloud environments is not yet a widespread practice. Nonetheless, a few tools are currently available for this purpose. For instance, Scaphandre can be deployed on each node within a cluster. It features a Prometheus exporter, simplifying the aggregation of logs across the cluster for visualization in a Grafana Dashboard—a guide and example of which can be found on Scaphandre's project website [guide].
Scaphandre Dashboard Example [source]
Kepler represents another project in this space, offering a higher level of metric detail tailored for Kubernetes environments. It enhances granularity in two primary ways: through the use of machine learning models and the integration of eBPF for energy consumption estimation, as detailed in its [documentation].
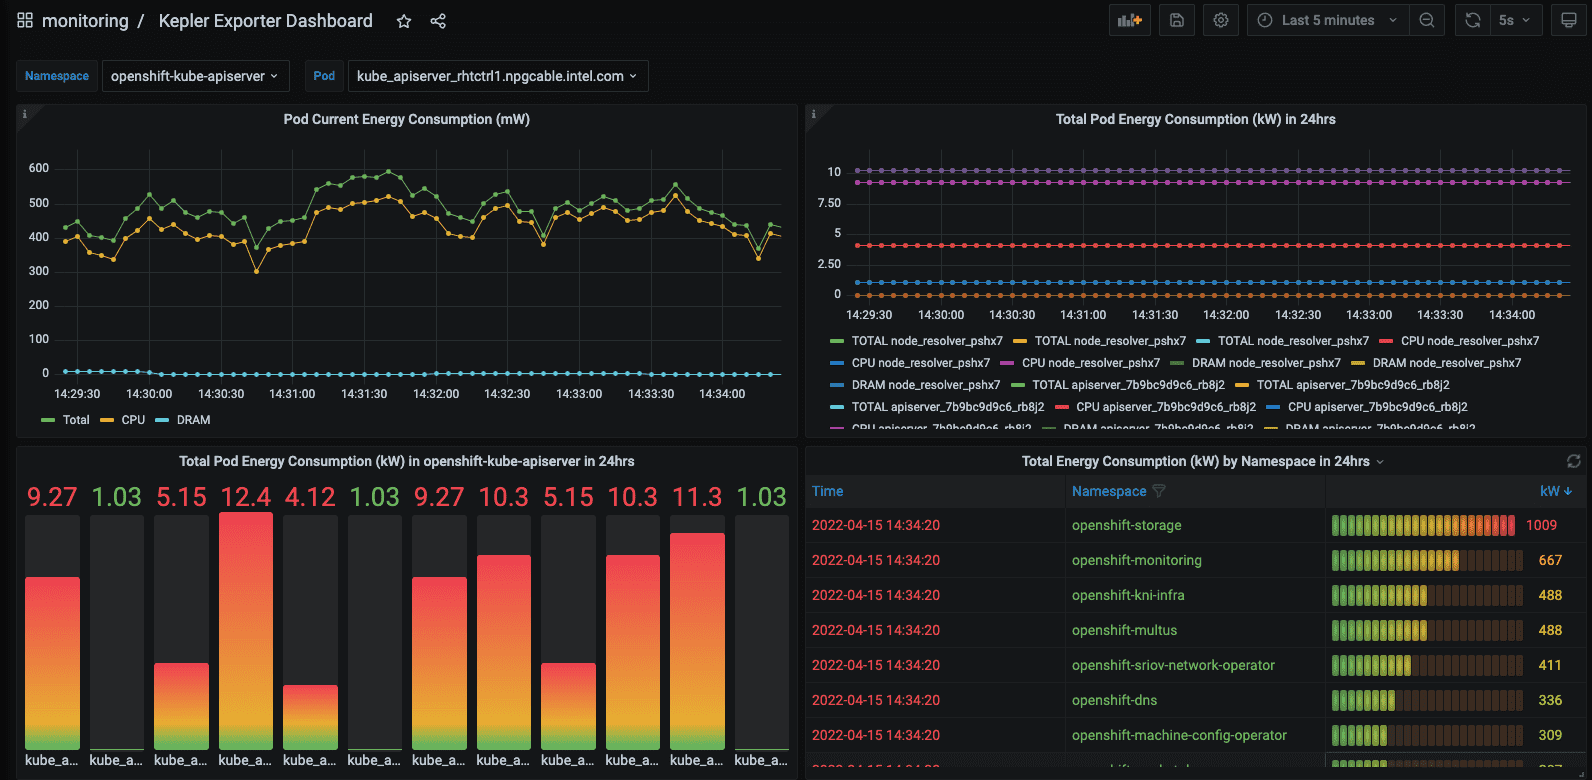
Kepler Grafana Dashboard Example [source]
- Use of Machine Learning in Kepler: Kepler leverages machine learning (ML) techniques to estimate the power consumption of virtualized applications when direct access to the bare metal hardware is unavailable [documentation].
- eBPF Utilization: eBPF is used for the acquisition of more granular data. The collected node-level metrics from RAPL, nvidia_smi etc. are getting broken down to pod-level metrics. Kepler employs eBPF to compute these metrics through the analysis of various Linux performance events (perf) [documentation].

Both Scaphandre and Kepler capture relevant energy metrics, with Kepler offering a more detailed analysis, both on a node and pod level. However, the key question is whether the metrics provided by these tools align with our needs to advance cloud-native sustainability within our project system. Can we accurately identify energy consumption patterns in our cloud infrastructure? Reflecting on Kubernetes' capabilities, it becomes apparent that the metrics exposed by Scaphandre and Kepler do not provide clear insights in this regard. Let's envision what our ideal metrics would entail!
Conceptualize Cloud Native Energy and Resource Metrics
In the cloud context, other metrics become particularly relevant, metrics that provide an overview of the system's overall performance. This includes how Kubernetes or any other container orchestrator manages its responsibilities regarding energy and resource consumption. These metrics should be tailored to leverage the capabilities of the container orchestrator. Merely gathering standard OS/Linux metrics related to CPU utilization and energy consumption per process falls short of providing a comprehensive overview or pinpointing issues within the setup. Given Kubernetes' extensive capabilities, many of which could offer valuable insights when correlated with resource consumption and, more specifically, energy usage, it's worth exploring a few examples to demonstrate this approach.
| Kubernetes Capability | Metrics | Metric Family Description |
|---|---|---|
| Self healing | total_restarts_app_x: counter (captured by K8s), time_restart_app_x: gauge, energy_restart_app_x: gauge | Metrics related to app restarts, tracking the count, duration, and energy consumption of pod restarts. |
| Scalability | total_scaleup_app_x: counter, total_scaledown_app_x: counter, time_sec_scaleup_app_x: gauge, time_sec_scaledown_app_x: gauge, energy_scaleup_app_x: gauge, energy_scaledown_app_x: gauge | Measures app scaling, capturing the frequency, duration, and energy usage of scale-up and scale-down events. |
| Traffic (egress / ingress) | total_mb_egress_throughput_svc_x: counter, mean_mb_egress_throughput_svc_x: gauge, mean_energy_egress_throughput_svc_x: gauge, total_mb_ingress_throughput_svc_x: counter, mean_mb_ingress_throughput_svc_x: gauge, mean_energy_ingress_throughput_svc_x: gauge, Maybe a histogram here. To show the "travel distance" based on response time (in the direction of dns dig). | Tracks data throughput of services and response times for incoming and outgoing network traffic and mapping this to energy consumption. Metrics are based on time windows. |
| Rollout | total_rollout_app_x: counter (captured by K8s), time_rollout_app_x: gauge, energy_rollout_app_x: gauge | Focuses on the deployment process, quantifying the number, duration, and energy usage of app rollouts. |
These metrics serve merely as examples to illustrate the concept. Assessing how the system utilizes resources to support other Kubernetes functionalities is also crucial. Ultimately, the complete list of metrics would be more extensive, necessitating the development of a more detailed version alongside a proof of concept (POC). This is an area the CNCF TAG Environmental Sustainability could explore, especially if there's interest from the community in supporting such a project. Some metrics may primarily target Kubernetes maintainers rather than platform engineers, which also requires careful consideration.
Collecting the Metrics
It's important to note that observability comes at a significant cost, which may not always be justified. Continuous monitoring of every metric isn't necessary. These metrics could prove particularly useful during the initial system setup, for periodic reviews over a couple of days each month to track changes in resource usage, or during debugging sessions.
Kepler's detailed approach to metrics collection addresses a key aspect of the data we need for these new metrics. This needs to be taken further to better capture platform engineering aspects. Utilizing eBPF provides a bridge from the cluster level down to the kernel of individual nodes, allowing for the capture of the best raw data possible. Where gaps remain, machine learning models could offer insights, pending the development of appropriate interfaces.
These metrics would enable platform teams to refine platform configurations and collaborate with developer teams to enhance application design. Additionally, some metrics could serve as the basis for automated decision-making regarding scalability and scheduling in Kubernetes. They might also act as key performance indicators (KPIs) for assessing platform maturity.
This concludes our blog post series. Thank you for following along.